Cap rate can make a property look cheap, safe, or wildly overpriced in about five seconds. But that quick number only helps when you know what sits behind it. I’m Robbie English, REALTOR, Broker, and I’ve spent more than 40 years helping Texans weigh property choices. Here are the main cap rate real estate options I’d put side by side before making an offer.
1. Robbie English, REALTOR, Broker
Robbie English, REALTOR, Broker is an Austin-based resource for investors who need local property guidance before they trust a spreadsheet. I help buyers study investment properties in Austin and across nearby Texas markets.

My role is not to pick a cap rate in isolation. I help you check the rent story, property taxes, insurance, repairs, vacancy assumptions, and the price a seller wants. Those details can change the result more than a small difference in the advertised rate.
For example, a rental with a 6% cap rate may look stronger than one at 5%. But if the first property needs major work or has weak leases, the lower rate may carry less risk. I want to see the actual income statement and compare it with nearby sales before drawing a conclusion.
For Austin buyers, local details matter. A property may face different taxes, insurance costs, lease demand, or development pressure than a similar asset elsewhere in Texas. You can also review my Austin real estate investor market guide for a closer look at local rental returns.
I also help sellers understand how buyers may value the same NOI. That can shape pricing, negotiations, and the timing of a sale. The numbers still belong to you. My job is to help you read them clearly.
2. Multifamily Class A: Lower Yield With Income Stability
Multifamily Class A properties often sit at the lower end of the cap rate real estate range because buyers pay for newer buildings, strong locations, and expected income growth.

North Texas data places this group near a 5.0% average cap rate, with a reported range of 4.8% to 5.2%. A separate Dallas-Fort Worth market report described prime Class A properties trading around 4.50% to 4.75% in some cases. Those buyers were often paying cash because debt costs could exceed the property yield.
That spread matters. If the property earns less than the cost of borrowed money, financing may reduce cash flow instead of helping it. An all-cash buyer may accept the lower initial yield because the asset has newer systems, strong tenant demand, or room for rent growth.
Still, a new building is not risk-free. Concessions can reduce collected rent. New supply can pressure occupancy. A property that looks stable on a pro forma may need time to reach its expected income.
Austin investors should be careful with trailing numbers when the market is still adjusting. Rent changes, lease trade-outs, and concessions can make last year’s NOI a poor guide to the next year.
Class A fits an investor who values income stability and property quality more than a high going-in yield.
3. Multifamily Value-Add: Higher NOI Potential
Multifamily value-add properties can give investors a path to raise NOI through better leasing, repairs, unit upgrades, or tighter expense control.
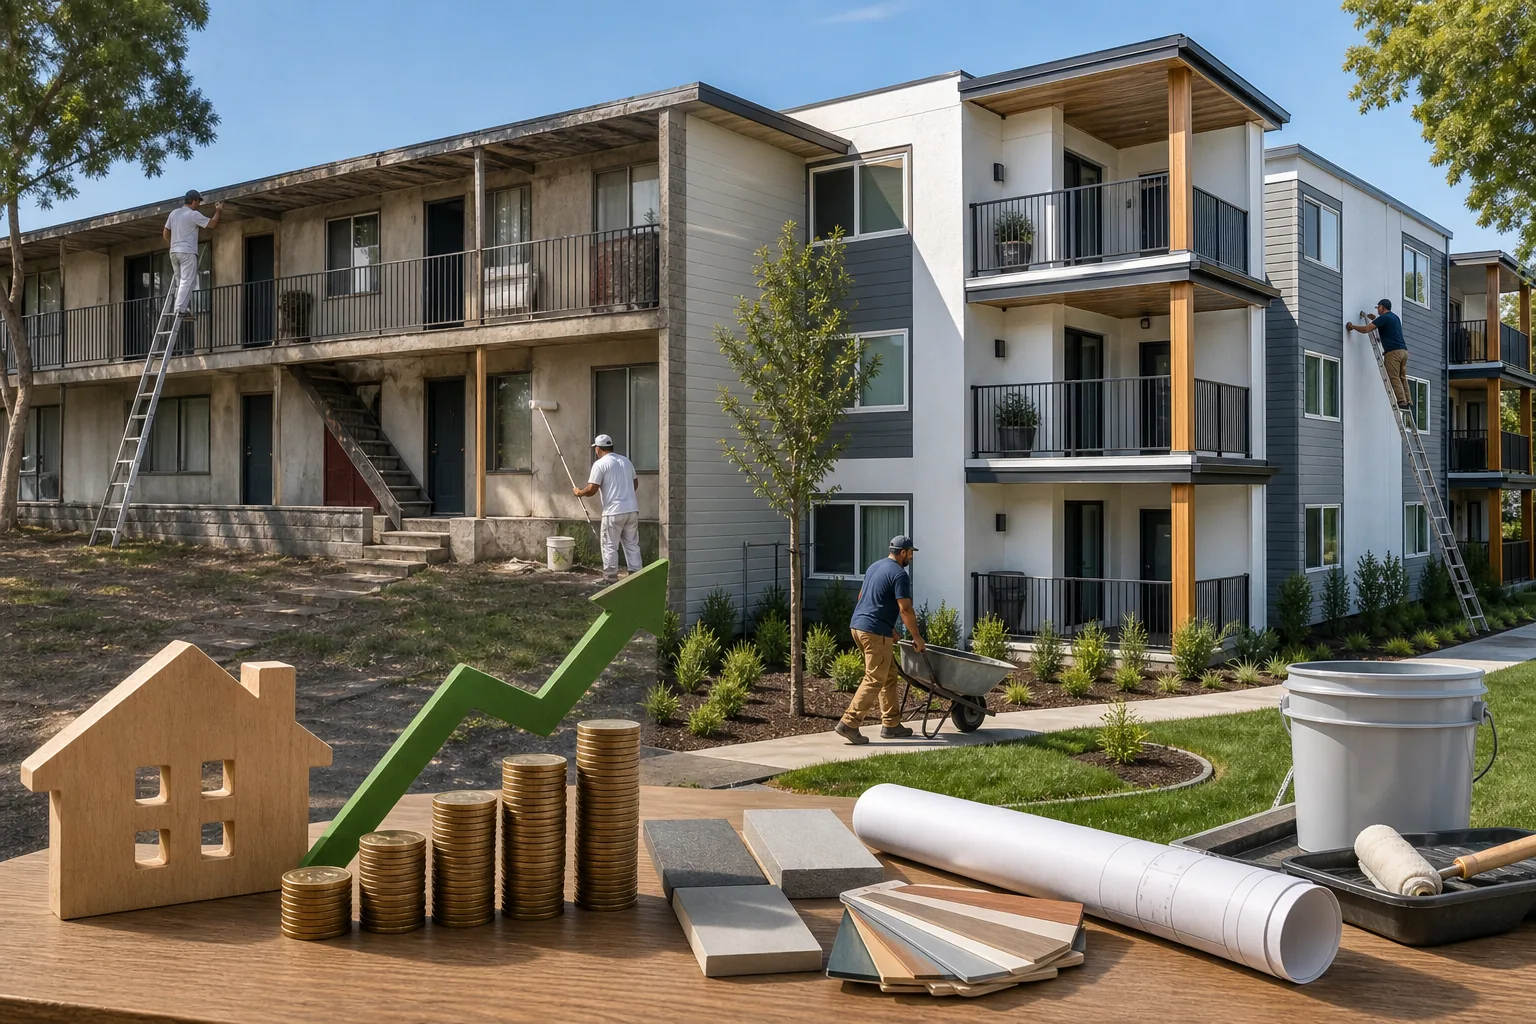
The reported North Texas average cap rate for this group is about 6.0%, with a range of 5.7% to 6.3%. The number alone does not tell you if the plan works. You need to test the cost of the work against the rent increase you expect to earn.
Suppose a property has $500,000 in current NOI. At a 6% cap rate, its rough value reflects that NOI and the market rate. If the owner raises NOI and the market still accepts a 6% cap rate, the rough value can increase. That is the basic link between NOI growth and value.
But the market may not keep the same rate. Renovation costs may run over budget. Units may sit vacant during the work. Local rents may not support the planned increase. Your loan may also require interest payments before the new income arrives.
For that reason, I would underwrite at least three cases: the plan works on time, the plan takes longer, and the plan fails to reach the target rent. A value-add deal needs enough cash and time to handle the middle case.
This category fits an investor who can manage a work plan and accept uneven cash flow early in the hold.
4. Multifamily Workforce: More Income, More Operating Sensitivity
Multifamily workforce properties often show a higher cap rate because buyers face more operating risk, older buildings, or greater sensitivity to repairs and vacancy.

North Texas data puts the average near 6.85%, with a reported range of 6.5% to 7.2%. That spread over Class A can look tempting. Yet the extra yield may reflect deferred maintenance, weaker collections, less room for rent growth, or a smaller pool of future buyers.
Older properties can also have uneven systems. One roof repair may affect a year of cash flow. A plumbing issue can force unit downtime. If the property has many smaller leases, management effort rises even when the rent roll looks full.
I would inspect more than the rent list. Review work orders, delinquency, turnover, utility bills, insurance claims, and tax records. Ask which expenses the seller paid personally and which ones appear below the NOI line.
Workforce housing may suit an investor with strong reserves and hands-on operating support. It may not suit someone who needs smooth income from the first month.
The higher rate is compensation for work and uncertainty. It is not a free bonus.
5. Industrial: Lease Structure Matters
Industrial properties can produce a useful cap rate real estate comparison, but the lease structure may matter as much as the headline yield.

One North Texas market source reports an average industrial cap rate near 6.2%, with pricing around $140 per square foot and vacancy near 6%. Smaller industrial spaces were cited at roughly $10 to $12 per square foot on a NNN basis.
With a triple-net lease, the tenant may pay some property taxes, insurance, and maintenance costs. That can reduce the owner’s operating burden. But you still need to read the lease. A tenant may have renewal rights, expense caps, repair limits, or a short remaining term.
A single tenant creates another risk. If that tenant leaves, the property can lose most of its income at once. A multi-tenant building spreads that risk, but it adds leasing work and turnover costs.
Industrial also carries a high purchase price per square foot in the cited data. A 6.2% cap rate on a costly asset may require more equity than a similar yield on a lower-priced property.
Before comparing two buildings, place their lease terms beside the NOI. A strong rent roll with a near-term expiration date needs a different price than a long lease with clear expense recovery.
6. Retail: Tenant Quality and Vacancy Drive the Number
Retail can show a middle-range cap rate, but tenant quality and vacancy can move the value quickly.
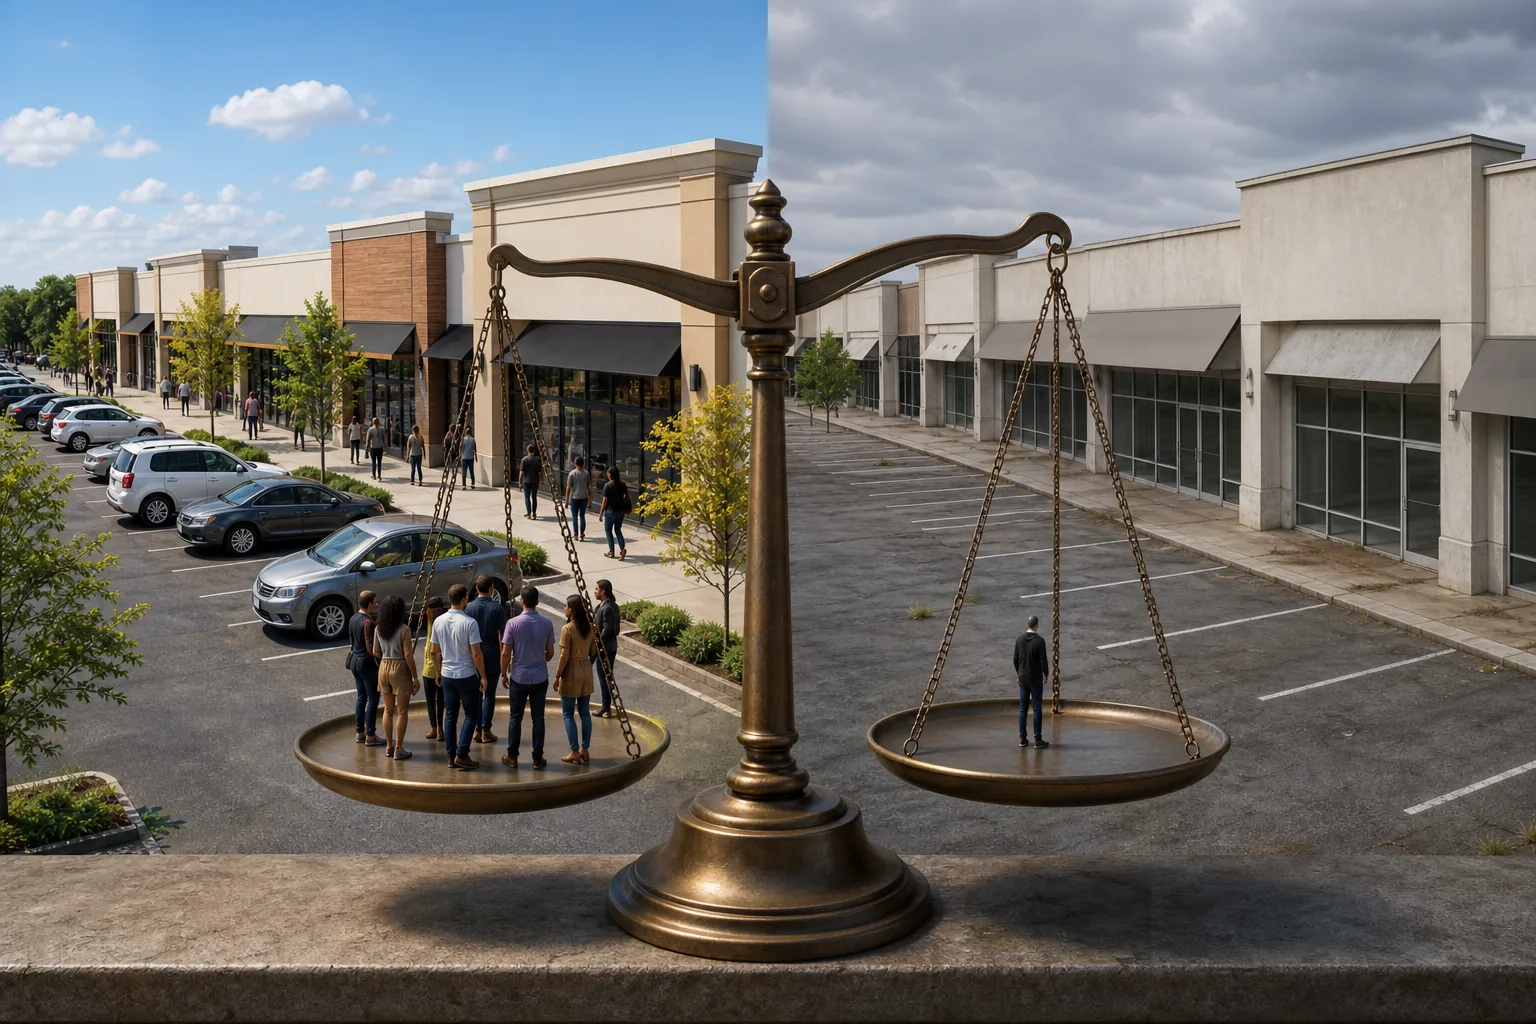
North Texas retail data reports an average cap rate around 6.7%, vacancy below 5%, and average asking rent near $24.91 per square foot. Those are market averages, not a promise for any specific center or storefront.
A retail property with one strong tenant may have simple management. It may also face a large income loss if that tenant leaves. A center with many tenants spreads lease risk, but it brings more turnover, maintenance, and leasing decisions.
Look closely at the lease schedule. Check expiration dates, renewal options, rent steps, tenant allowances, and unpaid charges. Then ask how long a vacant space might take to lease. A low vacancy rate in the wider market does not protect a property with poor access or weak visibility.
Retail valuation also depends on the use of the space. A tenant may pay rent on time today while the location becomes harder to lease later. The cap rate should reflect that risk.
I’d rather see a modest rate supported by clear leases than a high rate based on rent that exists only in a seller’s forecast.
7. Office Properties: Class A, B, and C Risk Profiles
Office properties show how a high cap rate can signal both opportunity and serious risk.

North Texas figures place Class A office near an 8.4% average cap rate. Class B is near 8.7%, while Class C reaches 9.0% or more. The higher rates reflect lease-up risk, tenant improvements, rent concessions, and uncertainty around future office demand.
Class A may suit a value-add investor who has a clear plan for tenant demand and building upgrades. Class B can offer a different price point, but the buyer still needs to test capital needs. Class C may show the highest rate while needing the most work.
A lease that expires soon can create a large cash need. The owner may have to pay for new flooring, build-out, moving allowances, or months of free rent. Those costs may not appear in the current NOI.
Commercial real estate valuation requires care with income and market assumptions. Appraisers and investors may use comparable transactions, expected income, and risk adjustments rather than rely on one simple ratio.
Office works only when the buyer can explain the tenant plan. A high rate without that plan is a warning sign.
8. Agricultural or Open-Space Land: A Different Income Model
Agricultural or open-space land has a different cap rate real estate story because Texas appraisal rules focus on productivity value rather than ordinary market value.

For 2026, the Texas Comptroller reports a 10.00% cap rate for qualified agricultural or open-space land. The figure is used by appraisal districts when calculating productivity values. It does not mean every parcel delivers a 10% investment return to an owner.
The Comptroller explains that districts estimate typical income from the land, subtract certain costs, and divide the average net-to-land over a five-year period by the annual cap rate. Property features and the land’s actual agricultural use also affect the result.
That distinction is easy to miss. A productivity cap rate can affect taxes without telling you what the property earns after all ownership costs. A parcel may have fencing needs, water costs, equipment expenses, management demands, or limited sale liquidity.
Before buying, confirm the property’s qualification status and review the appraisal district’s records. Ask what happens if the use changes. A tax benefit tied to agricultural use may not continue after a different use begins.
The 10% figure is useful for understanding Texas appraisal rules. It should not replace an investment cash-flow model.
9. Timberland: Land Yield Plus Long-Term Holding Risk
Timberland combines land ownership with a long production cycle, so its cap rate needs a different reading than an apartment or retail property.

The Texas Comptroller reports a 7.77% timberland cap rate for 2026 appraisal purposes. As with agricultural land, that rate helps calculate productivity value. It is not a guarantee of annual cash income.
Timber income may arrive in uneven periods rather than as monthly rent. The owner may also face costs tied to roads, surveys, management, fire risk, and harvesting plans. Market demand for timber can change before the owner is ready to sell.
Land value adds another layer. A parcel may have development potential, conservation limits, water access, or a highest-and-best use that differs from its current use. Those facts can affect the sale price beyond its productivity income.
I would separate three questions: What does the land earn now? What will it cost to hold? What might a future buyer pay for the land and timber rights?
Timberland may fit a patient investor who can accept irregular income. It is a poor match for someone who needs monthly distributions.
Cap Rate Comparison: Which Real Estate Option Fits the Analysis?
Cap rates help you compare property types, but the right comparison uses matching assumptions. A 5% Class A multifamily deal and a 9% Class C office deal do not carry the same lease risk, capital needs, or income outlook.
The basic formula is simple:
Cap rate = net operating income divided by purchase price.
Here is a quick example. Start with a property’s annual income, subtract operating expenses, and divide the resulting NOI by the purchase price to calculate the cap rate.
Reverse the formula and you can estimate value. Divide NOI by the market cap rate to estimate implied value. A lower cap rate produces a higher implied value for the same NOI, while a higher cap rate produces a lower implied value. That inverse relationship is why cap-rate compression can push values higher, while expansion can push values lower.
These figures come from different sources and uses. The Texas agricultural and timberland rates are appraisal inputs. The commercial figures are market observations. They should not be treated as directly comparable figures.
When comparing a deal, financing also matters. Cap rate is unlevered, so it excludes mortgage payments and interest. Cash-on-cash return measures cash flow after debt against the cash invested. IRR adds the timing of cash flow and sale proceeds. Equity multiple shows total distributions compared with invested equity.
Each measure answers a different question. Cap rate helps compare the property. Cash-on-cash helps judge current investor cash flow. IRR helps test the whole hold period. Equity multiple shows how many dollars may come back for each dollar invested.
Do not mix going-in, stabilized, and exit cap rates. The going-in rate uses current NOI. The stabilized rate uses an expected NOI after lease-up or improvements. The exit rate estimates the sale value at the end of the hold. A conservative model often tests a higher exit cap rate than the purchase rate, because a buyer should not assume the market will always pay more.
Appraisers and brokers also study comparable sales. They look at recent transactions with similar property type, location, condition, lease terms, and income. Then they adjust for differences. A market-derived cap rate is only useful when the comparable properties truly match.
For an Austin investor, I’d begin with verified property income and local expenses. My Austin investment property landlord guide explains why reserves, financing costs, and taxes need attention before closing.
Use cap rate to ask better questions, not to end the analysis. If the answer changes when you replace projected rent with collected rent, the deal needs more review.
How do you calculate a cap rate?
You calculate a cap rate by dividing net operating income by the property’s purchase price or market value. NOI equals operating income minus operating expenses. Mortgage payments stay out of the formula, so the result shows an unlevered first-year yield rather than the return on your actual cash invested.
What is a good cap rate in real estate?
A good cap rate depends on property type, location, lease strength, growth potential, and risk. A lower rate may fit a newer asset with stable income. A higher rate may compensate you for vacancy, repairs, or weak demand. Compare similar properties first, then test whether the NOI is current, collected, and sustainable.
Does cap rate include mortgage payments?
Cap rate does not include mortgage payments, interest, or other debt service. That is why two investors can buy the same property and receive different cash-on-cash returns while the cap rate stays the same. Review the loan terms separately, then compare debt service with the property’s NOI.
What is the difference between cap rate and cash-on-cash return?
Cap rate measures property income before financing against property value. Cash-on-cash return measures cash left after debt service against the cash you invested. Cap rate helps compare assets. Cash-on-cash helps judge how the financing affects your annual distributions. You need both for a financed purchase.
Why do cap rates change?
Cap rates change when investors revise their view of income growth, interest rates, risk, or future demand. When rates compress, buyers accept less yield and values may rise. When rates expand, buyers usually demand more yield and values may fall. Property-level changes can matter just as much as broad market shifts.
Conclusion
My recommendation is simple: use cap rate as your first comparison tool, then verify NOI, lease risk, expenses, financing, and your exit plan. If you’re considering an Austin rental or commercial investment, start with the numbers you can document and ask Robbie English, REALTOR, Broker to help you compare the property with local evidence. You can also review my rental property investment options guide before deciding what fits your finances.