When looking at the real estate market data, we can see that there is a correlation between several key metrics.
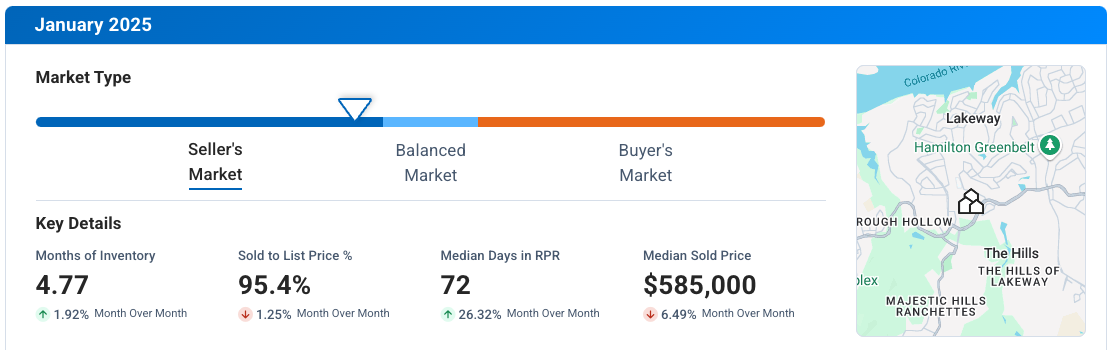
First, let’s consider the Months Supply of Inventory, which is currently at 4.77. This number tells us how many months it would take to sell all the current inventory of homes on the market at the current sales pace. A lower number indicates a seller’s market, while a higher number indicates a buyer’s market.
Next, we have the 12-Month Change in Months of Inventory, which has increased by 16.91%. This means that the housing market has become slightly more favorable for buyers over the past year, as there are more homes available for purchase.
The Median Days Homes are On the Market is 72, which tells us how long it takes, on average, for a home to sell once it is listed. A lower number indicates a faster-moving market, while a higher number indicates a slower-moving market.
The Sold to List Price Percentage is 95.4%, which shows that homes are typically selling for about 95.4% of their listing price. This can give sellers an idea of how much negotiating room they may have when pricing their home.
Finally, the Median Sold Price is $585,000, which is the middle point of all the home sale prices in the area. This can give both buyers and sellers an idea of what homes are selling for in the current market.
Overall, these metrics show that the real estate market is fairly balanced, with a moderate supply of inventory, reasonable days on the market, and homes selling close to their listing prices. Buyers and sellers can use this information to make informed decisions about buying or selling a home in this market.
If you would like to know more about what is happening in your particular area, let’s schedule some time to speak. Each market is different and there are micro markets that may provide additional insight. My team and I at Uncommon Realty are here to help you. I look forward to discussing what is going on with your area.


Leave a Reply